Blog

  • Research: Digital inequality in the Appalachian Ohio: Understanding how demographics, internet access, and skills can shape vital information use (VIU)

    Research: Digital inequality in the Appalachian Ohio: Understanding how demographics, internet access, and skills can shape vital information use (VIU)

    The Internet is one of the most revolutionizing technologies in the world, that brings with it a great deal of optimism for the betterment of humanity. In the information age, access to the Internet and the ability to use it effectively have become increasingly important for a person’s economic, political, and social wellbeing. Individuals use the Internet to not only connect to each other, but also educate themselves, share and receive information, engage in monetary transactions, entertain, and do just about everything that online communication affords.

    Digital inequality can take various forms (Pearce and Rice, 2013), and is prevalent in various parts of the United States (U.S.). However, digital inequality is more acute in the rural areas of the country like the Appalachian region. According to the U.S. Census Bureau, in the year 2015, about one-fifth of Americans did not have broadband Internet at home (Ryan and Lewis, 2017); and nearly one-third of Ohioans in rural counties do not have broadband Internet access (Wedell, 2018). This translates into a wide access gap in terms of poor Internet quality, which in turn impacts Internet access, usage, levels of service adoption and utilization of beneficial outcomes.

    Among other things, the internet affords certain important or vital uses according to the degree of their necessity to an individual. Through the use of the internet that requires access, media literacy, and efficient utilization, a person is able to fulfill his or her wellbeing needs, informational or learning needs, economic needs, and social connectivity needs. We are more interested in understanding vital uses of the internet that include goal-oriented activities that lead to tangible beneficial outcomes instead of purposeless time-wasting activities (Selwyn et al., 2005). We therefore introduce the concept of Vital Internet Use (VIU) to understand the factors that lead to beneficial outcomes of Internet use. VIU can be defined as the use of Internet services that are related to basic social needs such as health, education, job search, and information search. VIU also includes the use of social media as it can open doors for social and informational resources. The concept of VIU is based on the premise that even when Internet access is available, increased Internet use does not always translate into beneficial outcomes from its use. The extent of utilization of these services can potentially determine the citizens’ participation in their communities as well as the citizens’ rights acknowledgment and exercising. The focus of our research is to better understand the remaining dimensions of digital inequality among community members in Appalachia. We hope to gain new insights into how digital access varies, and how social structural differences within this understudied population may be shaping the vital uses they pursue. Through a survey, we explored digital inequalities in counties of south eastern Appalachian Ohio. We propose a comprehensive framework whereby access is understood in terms of physical Internet access (infrastructure, hardware, software), and Internet usage skills (operational, technical, navigational, cognitive-creative, and social skills) to achieve beneficial outcomes or Vital Information Use (VIU).

    Abstract: Access to information and resources via the Internet is an increasingly vital dimension of contemporary life. However, there can be several impediments to optimal Internet utilization in the form of access, skills, and motivation. Even when access is available, several digital inequalities arise as citizens often lack the skills and motivations to pursue those vital uses through the Internet to the best of their advantage. Digital inequalities in the hills of the Appalachian area of Ohio are often manifested in terms of social, cultural and geographic divides. Not only do the hills block wireless signals and make cables expensive to install, but regional poverty also drives away telecom investment. We conducted a survey of Appalachian Ohio to explore digital inequity issues and the determinants of online participation for things that matter. Through a number of analyses, we explore how Internet access and digital skills impact online contribution to the community in terms of services and resources considered to be basic social needs: health, employment, education, and social media. These social needs, what we have called Vital Internet Use (VIU) can determine citizens’ political and civic participation, societal contribution, and overall benefit to their communities. Centered on the concepts of digital access, Internet skills, and benefit outcomes, we extend knowledge in this domain and propose a comprehensive framework of VIU.

    The study can be access on the Telematics and Informatics journal website: https://www.sciencedirect.com/science/article/pii/S0736585320300393
    and cited as:

    Khan, M. L., Welser, H. T., Cisneros, C., Manatong, G., & Idris, I. K. (2020). Digital inequality in the Appalachian Ohio: Understanding how demographics, internet access, and skills can shape vital information use (VIU). Telematics and Informatics50, 101380.

    A pdf of the article (author’s personal copy) is available here, for research and educational purposes only.

  • Network Visualization and Analysis with Gephi

    Network Visualization and Analysis with Gephi

    Network analysis can simply be understood as the analysis of social networks. The analysis provides a visual representation of different members (or nodes) within a network, and how they connect to each other.

    I use Gephi to visualize networks based on data from Twitter and Facebook. I would highly recommend the following book: Analyzing the Social Web by Jennifer Golbeck (available on Amazon), to understand social network analysis.

    Here are a few videos that are useful in understanding social network analysis using Gephi.

    Video 0: (Updated Gephi tutorial for Les Miserables dataset (https://github.com/gephi/gephi/wiki/Datasets)

    Video 1: Visual Analysis of Social Networks

    Video 2: A Walkthrough Analysis of Tor Networks in Gephi

    Video 3: Gephi Tutorial: Finding Shortest Paths

    Video 4: Gephi Labels and Colors

    Video 5: Gephi Modularity Tutorial

    Video 6: Gephi Tutorial: Filtering Networks

    Video 7: How to Look at Node Labels in Gephi

    Video 8: Gephi Tutorial on Network Visualization and Analysis

  • Sentiment Analysis with SentiStrength

    Sentiment Analysis with SentiStrength

    The following is a tutorial for conducting a quality sentiment analysis of social media data (in this case X/Twitter). I describe what sentiment analysis is, how it started, and why it is important. I also offer a sentiment analysis process that I believe sums up the technique. I then introduce a valuable tool called SentiStrength. Following data cleaning and analysis, sentiment is visualized.

    SentiStrength has already been employed by researchers and findings have been published in a range of scholarly research journals. I am quite confident that you will find this sentiment analysis tutorial beneficial.

    What is Sentiment Analysis?

    Sentiment analysis is the automated process of understanding opinions and emotions about a given subject from written or spoken language. Sentiment analysis is also known as opinion mining, opinion extraction, sentiment mining, subjectivity analysis, affect analysis, emotion analysis, and review mining.

    According to the Merriam-Webster’s Collegiate Dictionary, sentiment is defined as an attitude, thought, or judgment prompted by feeling.

    Sentiment analysis presents an active area of research in natural language processing (NLP). NLP is considered a sub-field in artificial intelligence whereby computers are able to interpret and process human language.

    How it all started?

    Sentiment analysis has been used across various disciplines. It is believed to have started from computer science. Later, management and then social sciences adopted sentiment analysis. Sentiment analysis has been extensively used in linguistic and machine learning studies.

    Large corporations have built their own in-house capabilities (e.g., Microsoft, Google, IBM, SAP, and SAS).

    Basic Sentiment Analysis: Classifying the polarity of a given text at the document, sentence, or tweet—positive, negative, or neutral.

    Advanced Sentiment Analysis: Understanding emotional states. For example, happy, angry, and sad.

    Why is it important?

    Sentiment analysis has attracted interest from researchers, journalists, companies, and governments. Opinions and sentiments are extracted to create structured and actionable knowledge that can be used by a decision maker.

    The advent of social media has increased the value of sentiment analysis. Social networks are not only fueling the digital revolution, but also enabling the expression and spread of emotions and opinions through the network.

    Leveraging of new media requires constant monitoring of information. In the political arena, sentiments can determine election outcomes; business carefully guard their brand image and user sentiment on social media needs to be constantly monitored.

    Issues in Sentiment Analysis

    The most problematic figures of speech in NLP are irony and sarcasm. Another issue is of the rules to detect implicit sentiment (e.g., through misspellings or exclamation marks).

    A sentiment analysis program typically achieves 70% accuracy in classifying sentiment.

    Human raters typically only agree about 80% (Ogneva, 2012)

    Sentiment Analysis Process

    1. Topic Identification

    What are you interested in knowing? State the research question. Why does it matter? Who cares?

    • Medium Identification

    Identify where you want to study the sentiment. Will it be user generated content on social media? (YouTube comments, tweets on Twitter, Facebook posts, blogposts etc.)

    • Content Search

    Define keywords through which you will get the desired data. Clearly defined search parameters are of vital importance in getting the right kind of data that relates to the initial research questions.

    • Data Cleaning

    Raw data is full of noise. Data cleaning (especially social media data) requires ample sifting. Spam, fake accounts, data produced by bots, different languages etc. need to be cleaned or removed to create a clean data file.

    • Sentiment Analysis

    The clean data file can then be used to run the sentiment analysis.

    • Visualization

    Once the sentiment analysis is completed, data needs to visualized or put in an organized format to make sense of it.

    About SentiStrength

    Capture2

    SentiStrength is free for academic research and can be tried live online or downloaded (Windows only) from https://mi-linux.wlv.ac.uk/~cm1993/sentistrength/.

    Alternative Link: https://www.softpedia.com/get/Others/Home-Education/SentiStrength.shtml#download

    • SentiStrength is a program that compares social media text against a lexicon-based classifier of sentiments.
    • SentiStrength measures sentiment strength by assigning scores ranging from -.5 to +5.
    • Positive numbers indicate favorable attitudes while negative numbers indicate negative attitudes.
    • The program also provides a separate score for each word within a sentence thereby giving the average sentiment strength of the content (e.g. tweet).
    • Psychologists believe that human emotion can be positive and negative at the same time (Norman et al., 2011). These are commonly known as mixed emotions. Inspired by this psychological reasoning SentiStrength was created to detect both positive and negative sentiment at the simultaneously.
    • Emotions are socially constructed (Cornelius, 1996; Fox, 2008).
    • SentiStrength uses a lexical approach. At its heart is a lexicon of I, 125 words and 1,364-word stems, each with a score for positive or negative sentiment. When these match a word in a text then this suggests the presence of sentiment and its strength.
      For example, ailing has a score of -3 in the lexicon, and so sentences containing this word may have a moderate negative sentiment.
    • Positive sentiments can include words such as: good, happy, great, fantastic, wonderful, lovely, excited, lovely, nice, and kind. Negative sentiments can include words such as: terrible, lazy, crazy, hurt, bad, and disappointed.
    • Negation is commonly used when expressing opinions. A positive term that is preceded by a negating word (e.g., not, don’t) has its sentiment flipped by SentiStrength(e.g., I don’t like it), whereas negative terms are neutralized (e.g., I don’t hate you).
    • Terms preceded by booster words like very and extremely have their positive or negative sentiment strength increased, whereas quite decreases the sentiment strength of the next word.
      There are also rules for questions, idioms, spelling correction and punctuation as well as rules that are specific to computer- mediated communication methods of expressing sentiment.
    • As part of this, SentiStrength has a list of emoticons, together with sentiment strength scores for them (e.g., smiley faces like=) score +2). 
    • SentiStrength is very fast and can process 14,000 tweets per second on a standard PC), is transparent (shows how its scores were calculated), and includes other languages (Vural, Cambazoglu, Senkul, & Tokgoz 2013).

    Familiarizing with Twitter Data and data cleaning

    Before we start the analysis of social media data (in this case tweets), we need to clean the data and bring it in .txt file format so that it can be analyzed for sentiment in SentiStrength.

    We will be analyzing the sentiment around the Boeing 737 Max airplane which had caught international news headlines. Twitter data was obtained for this purpose using the keywords “737 Max”.

    For this tutorial, download the data file: “737_Max.xls

    Open the Excel file which contains the data for Bowing 737 Max tweets. View the raw datasheet “737_max_Raw”.

    The raw data from Twitter is depicted in the screenshot below.

    SentiStrength5

    Now click on “Clean_737_Max” worksheet.

    You will notice that the data file has been cleaned for (i) Retweets, (ii) languages other than English (iii) text that made no sense.

    For example, Spanish language tweets were deleted using the “filter” function in Excel.

    SentiStrength6

    We will export this worksheet and save it as a .txt file.

    The clean data file just containing the tweets is ready to be analyzed for sentiment in SentiStrength.

    Sentiment Analysis with SentiStrength

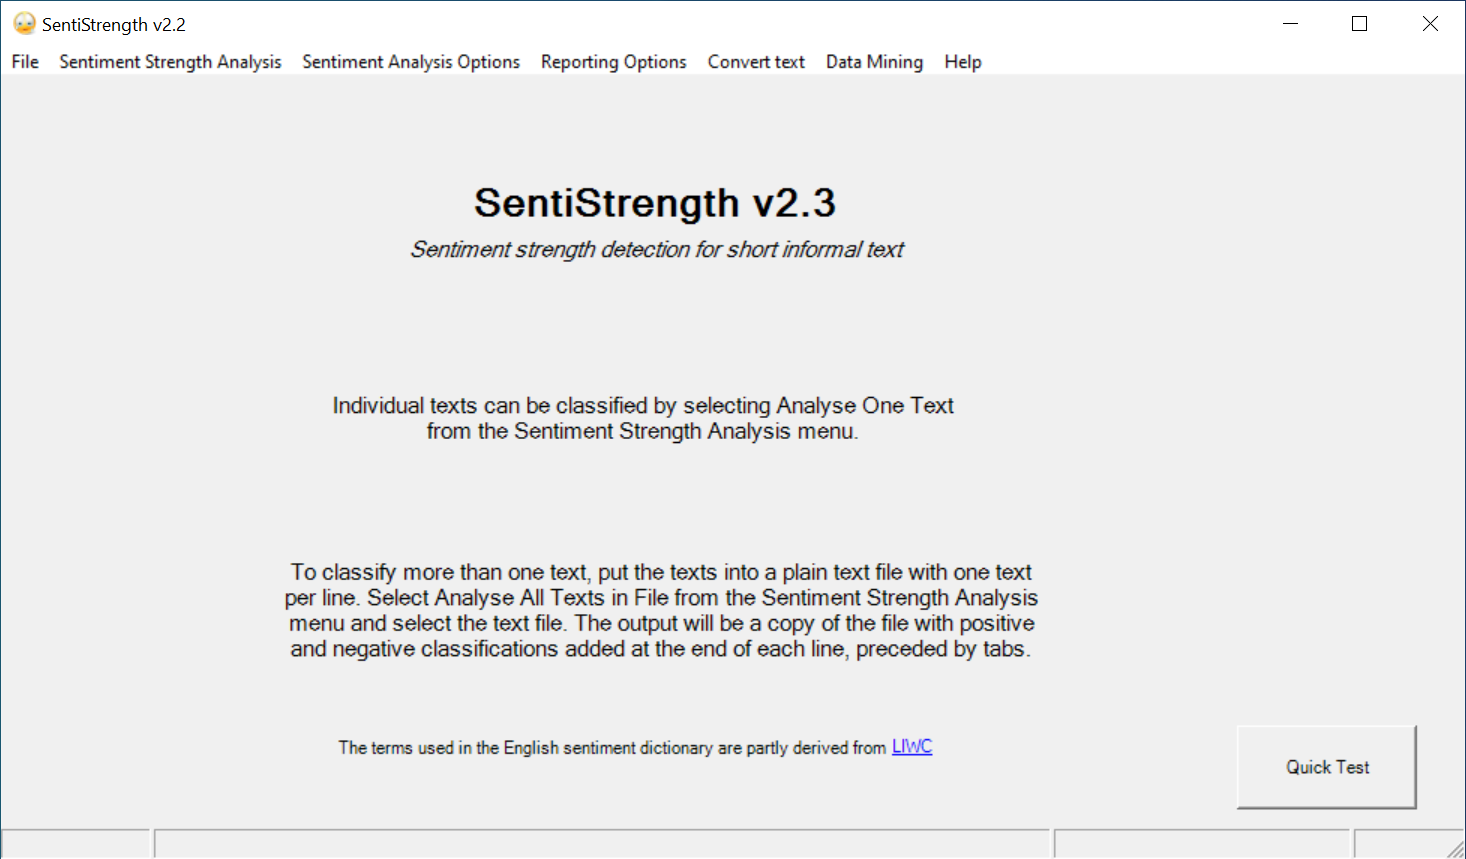
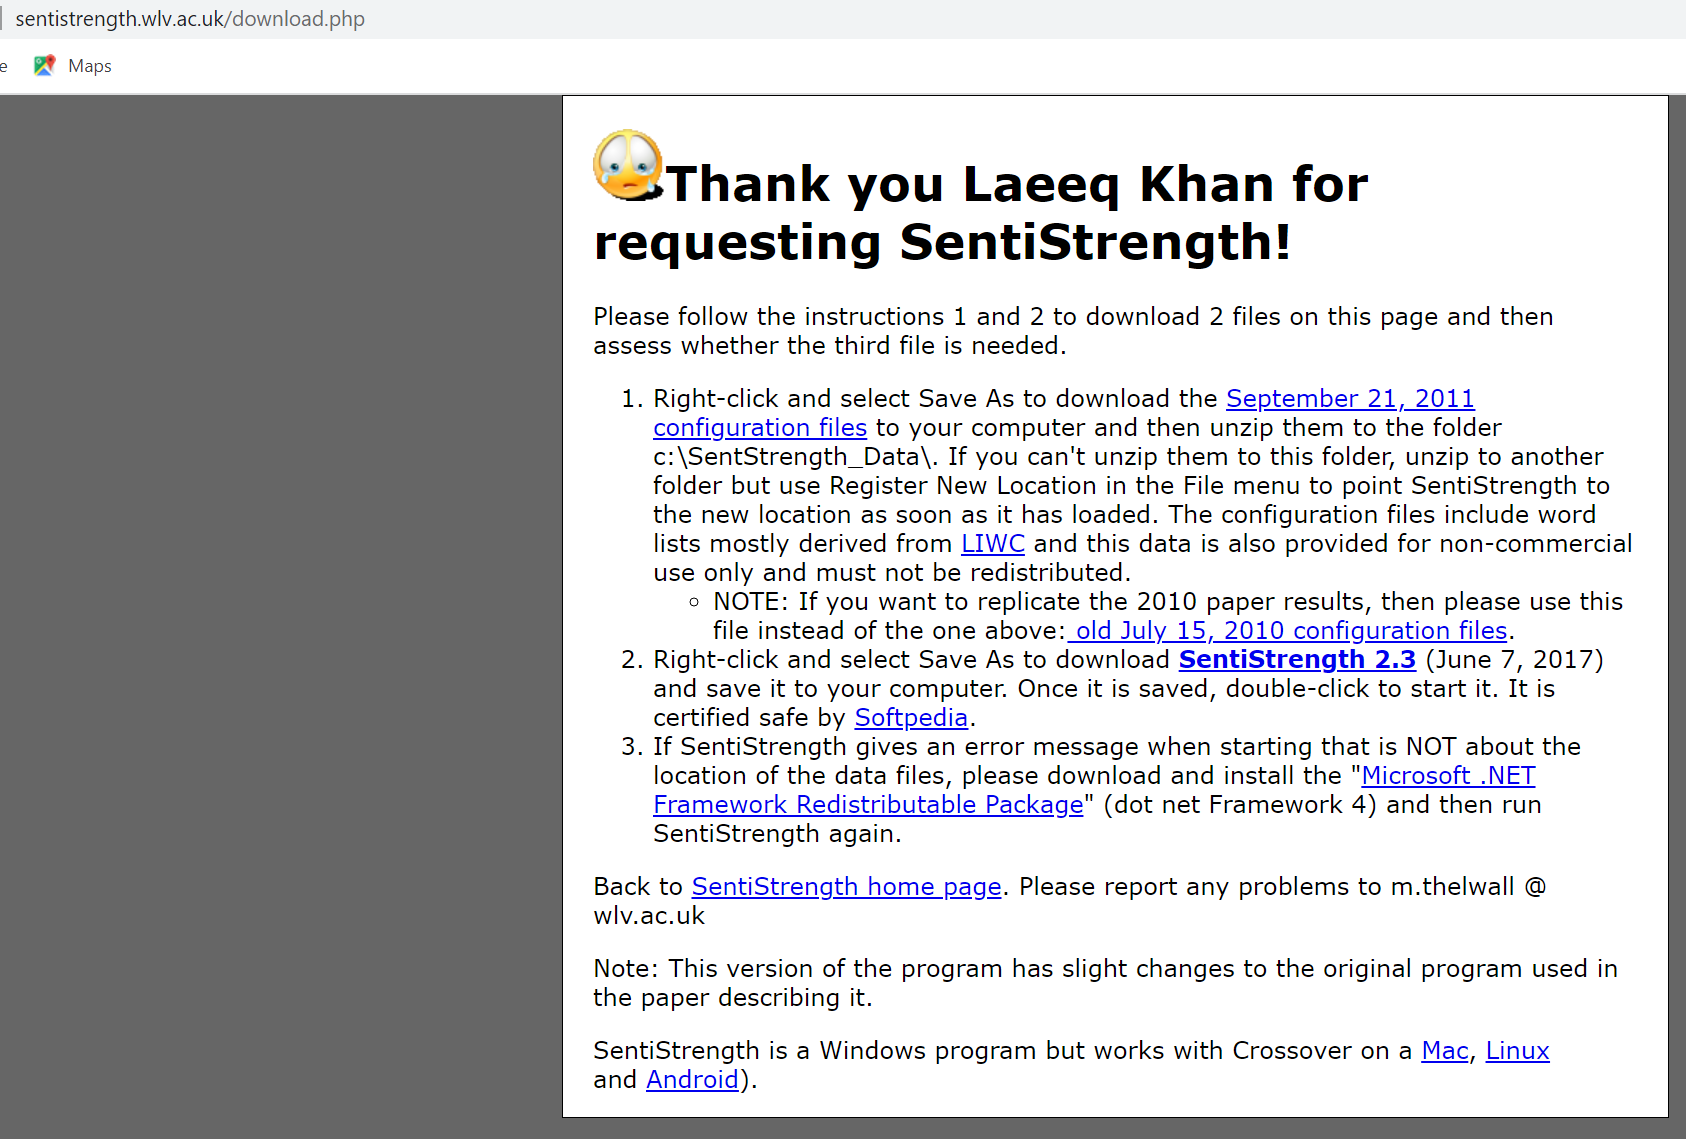
    1.     Download SentiStrength

    Download program and zip file SentiStrength_Data.zip from http://sentistrength.wlv.a.uk/

    Fill in the fields above with your name, email, and organization. You will be prompted to save the zip file on your computer. Save it in a new folder on your computer.

    Unzip SentiStrength_Data.zip, then start SentiStrength.exe and point to the unzipped SentiStrength_Data folder.

    sentiment2

    Click on the .exe file and launch SentiStrength. As you will notice, the most recent version is 2.3

    Sentiment1

    Explore the top menus. “Sentiment Strength Analysis” gives a list of options regarding the type of analysis that can be done. The following screenshot depicts the “Sentiment Analysis Options” which allows you to choose how you want your analysis to be done.

    SentiStrength4
    For this tutorial, we will be selecting “Analyse All Texts in File (each line separately)”. This is because our data file in .txt format contains all tweets in separate lines.

    SentiStrength3

    We can leave the default options selected.

    From the “Sentiment Strength Analysis” menu, we will be selecting “Analyse All Texts in File (each line separately)”. You will be prompted to choose the data file. Select the clean data file in .txt format.

    SentiStrength will now analyze the data and prompt to save a data file in which the sentiment has been performed (the file name will have “+results”).

    This new file is in .txt format and now has to be imported into Excel so that the analysis can be understood.

    Excel has a text import wizard that works when you try to open a .txt file.

    Once the three steps are followed, the data file with the results for the sentiment becomes visible in Excel in rows and columns.

    You will see a sentiment column for negative and positive. There is also a column for emotion rationale, which provides the sentiment score next to each word in the tweet.

    The final step is to visualize the overall sentiment by creating a new worksheet with the two sentiment columns. While selecting the sentiment columns, click on “Insert” and then select a “Column” chart to create a chart.

    You can create even better visualizations using Excel. As you can see in the above depiction, a simple column chart gives a general idea about the overall sentiment from this dataset.

  • Trust but verify (Доверяй, но проверяй, Doveryai, no proveryai)

    Trust but verify (Доверяй, но проверяй, Doveryai, no proveryai)

    2019 starts with an important research publication concerning the rise of misinformation and the importance of information verification:

    Khan, M. L., & Idris, I. K. (2019). Recognize Misinformation and Verify Before Sharing: A Reasoned Action and Information Literacy Perspective, Behavior & Information Technology, https://doi.org/10.1080/0144929X.2019.1578828.

    After a rigorous double-blind review by three reviewers, the paper is now finally published in Behavior and Information Technology journal. The topic is important from the perspective of dealing with irresponsible online sharing. Verifying information is vital against the backdrop of rising fake news and spread of misinformation on the Internet. Facebook, Twitter, and YouTube are popular sites for getting news and information. Sometimes, social media sites are criticized for serving as conduits of misinformation. Surveys and polls reveal heightened mistrust amongst people regarding media and information on social media. It is noticed that there is a great deal of carelessness amongst people who share information on social media. Surprisingly, a majority of people share links on Twitter without even reading them!

    The spread of misinformation poses real threats for our societies; having various types of negative consequences in the forms of stock price fluctuations, false advertising, health emergencies and crises, and even election outcomes. While social media platforms such as Facebook and Google are seen to be making efforts to tackle fake news and misinformation on their sites, such efforts have often been less than satisfactory. Our research therefore lays emphasis on what individuals can do to tackle misinformation instead of solely relying on social platforms and their fact-checking systems. We argue that users through information sharing behaviors, share responsibility for spreading inaccurate or false information on social media either intentionally or unintentionally.

    Rooted in the Theory of Planned Behavior (TPB) and information literacy factors, our research model helps us understand factors that can influence people perceived self-efficacy in recognizing misinformation as well as determine sharing behavior without verification.

    Khan_reasoned_action_information_literacy_model

    This study is based on the premise that as long as individuals try to distinguish false or inaccurate information from the accurate information, there is a lesser likelihood of them being misled. We believe that individuals lie at the center of any efforts in tackling the spread of misinformation. The abstract of the study is as follows:

    Abstract: The menace of misinformation online has gained considerable media attention and plausible solutions for combatting misinformation have often been less than satisfactory. In an environment of ubiquitous online social sharing, we contend that it is the individuals that can play a major role in halting the spread of misinformation. We conducted a survey (n = 396) to illuminate the factors that predict (i) the perceived ability to recognize false information on social media, and (ii) the behavior of sharing of information without verification. A set of regression analyses reveal that the perceived self-efficacy to detect misinformation on social media is predicted by income and level of education, Internet skills of information seeking and verification, and attitude towards information verification. We also found that sharing of information on social media without verification is predicted by Internet experience, Internet skills of information seeking, sharing, and verification, attitude towards information verification, and belief in the reliability of information. Recommendations regarding information literacy, the role of individuals as media gatekeepers who verify social media information, and the importance of independent corroboration are discussed.

  • Competing with Data Analytics in a Social World

    Competing with Data Analytics in a Social World

    I was invited by the Office of Vice President for Research and Creativity and the Ohio University to deliver a talk in Café Conversations discussing “Competing with Data Analytics in a Social World” on Wednesday, Sept. 26, at 5 p.m. in the Front Room at Baker University Center.

    Cafe-Ted-Ohio_Khan2Responding to the changing environment, organizations are employing data analytics to analyze big data to understand human behavior in digital spaces and make informed decisions that are aligned with their overall goals. Analyzing and visualizing data is a challenging endeavor. Organizations are struggling to understand what analytics can do and how it can provide a competitive advantage.


    While the focus is increasingly shifting from descriptive analytics to more sophisticated autonomous analytics, one issue remains the same: extracting value from data and telling a compelling story. Analytics has become a matter of survival, and proper harnessing of these capabilities can provide an organization a distinct advantage.

    cafeAnalytics

    I was met with a packed audience who were fully engaged and participated in the analytics trivia. Here is a video of the talk:


  • AEJMC in Washington D.C.

    AEJMC-Khan-DC2018-3The annual Association for Education in Journalism and Mass Communication (AEJMC) conference took place in Washington, D.C., from August 6th through August 9th. This year too, the gathering brought together hundreds of research scholars, educators, and practitioners from around the world. The conference is a go to place for anyone interested in knowing more about the latest research in the wider field of Communication.

    The AEJMC conference featured a number of high quality presentations, papers and demonstrations. This year, I attended AEJMC to present on a panel discussing the practical, theoretical and ethical challenges and strategies of teaching digital analytics. As Director of the SMART Lab at Ohio University, I shared my experiences regarding ethical challenges of teaching digital analytics. The overall panel comprised the following members:

    AEJMC-Khan-DC2018-1

    Panelists:

    • Itai Himelboim, University of Georgia,
    • Laeeq Khan, Ohio University
    • Lance Porter, Louisiana State University,
    • Robin Blom, Ball State University,
    • Moderator: YoungAh Lee, Ball State University.

  • Study of the U.S. Institute (SUSI) on Journalism and Media program

    Study of the U.S. Institute (SUSI) on Journalism and Media program

    The Institute for International Journalism (IIJ) in Ohio University’s E.W. Scripps School of Journalism hosts the Study of the U.S. Institute (SUSI) on Journalism and Media program. The program brings together journalism and media scholars from 18 different countries. This year too (SUSI 2018) the scholars attended an insightful and interactive presentation by Dr. Laeeq Khan, Director of SMART Lab and learnt about our work and research in social data analytics.

    SUSI program aims to “foster a deeper understanding of the roles that journalism and the media play in U.S. society”. The program has been successfully hosted at Ohio University for the last seven years.

    The SUSI program is an annual gathering of scholars and media experts from universities and academic institutions from around the world. The program is funded by the U.S. Department of State. What I really like about the program is how it brings together people from around the world and provides them a life-changing American experience. Not only does it connect diverse individuals but also enriches the environment at Ohio University during summer.

    Besides spending time at Ohio University, participants also visit various media outlets in across the United States. Attending the major journalism and media conference–AEJMC included in the overall program. The following countries are represented in the program: Botswana, Burma/Myanmar, Chile, China, Ecuador, Greece, India, Kyrgyz Republic, Lebanon, Malawi, Mongolia, Nepal, Pakistan, Uganda, Ukraine, Vietnam and Zambia. 

  • BEA – Las Vegas 2018

    BEA – Las Vegas 2018

    The Broadcast Education Association (BEA) had its 63rd Annual Convention in Las Vegas, Nevada, from April 07 – 10, 2018. If you haven’t heard about BEA, here is a brief introduction from their website:

    “The Broadcast Education Association (BEA) is the premier international academic media organization, driving insights, excellence in media production, and career advancement for educators, students, and professionals. The association’s publications, annual convention, web-based programs, and regional district activities provide opportunities for juried production competition and presentation of current scholarly research related to aspects of the electronic media. These areas include media audiences, economics, law and policy, regulation, news, management, aesthetics, social effects, history, and criticism, among others.  BEA is concerned with electronic media curricula, placing an emphasis on interactions among the purposes, developments, and practices of the industry and imparting this information to future professionals.  BEA serves as a forum for exposition, analysis and debate of issues of social importance to develop members’ awareness and sensitivity to these issues and to their ramifications, which will ultimately help students develop as more thoughtful practitioners.” [https://www.beaweb.org/]

    With colleagues from different universities I presented a panel titled: “Social Media Analytics at Crossroads”.

    The pervasive use of social media has led to an increasing realization about the need to measure and assess its impact. Measuring online social activity is commonly seen under the banner of social media analytics which comprises a set of interdisciplinary techniques and methods to evaluate big data. Social media analytics is at crossroads because of its evolving nature. Scholars in business, communication, and informatics domains are active in solving data-related complexities by employing social analytic software. The ability to use such software that allow data to be gathered, analyzed, and visualized, present a unique set of challenges and opportunities. It is this interdisciplinary focus that mandates the creation of a new skills-based curriculum that effectively meets the needs of students in disparate academic domains. This panel aims to provide valuable insights into how these unique challenges are being met.

    Other Presentations at the panel were as follows:

    • From the Structuration Theory to Active within Structures: An Integration of Divergent Audience Approaches – Roger Cooper, Ohio University
    • Communication Research: An Evolving Industry Perspective – Matt Kaiser, Ohio University
    • Social Media Analytics at Crossroads – Laeeq Khan, Ohio University
    • Integrating Big Data with Audience Reception Research – L. Meghan Mahoney, West Chester University of Pennsylvania
    • Measurement in Mass Communication Research: Trends, Opportunities, and Challenges – Tang Tang, Kent State University
  • New Research on Charity via Social Media

    New Research on Charity via Social Media

    Widespread social media use is impacting just about every aspect of life. Users around the globe are employing social media to connect and engage. Businesses, organizations and state institutions have all found social media to be of immense benefit in reaching their audiences effectively.

    My team at the SMART Lab in Scripps College of Communication at Ohio university keenly observes and researches the various social media affordances. One such affordance is the use of social media to promote charitable causes.

    We concentrated our efforts to look outside the developed world to understand how users in regions that are directly impacted by the digital divide (both access and skills) employ social media such as Twitter.

    We gathered online social data from an interesting and unique charity initiative called the Wall of Kindness that gained significant prominence in Pakistan, Afghanistan, and Iran. Our study is titled:

    “Communicating on Twitter for Charity: Understanding the Walls of Kindness Initiative in Afghanistan, Iran, and Pakistan”

    The study’s abstract is as follows:

    This study highlights the important role of social media for charity through an analysis of tweets about the “Wall of Kindness” charity initiative in Afghanistan, Iran, and Pakistan. Using both quantitative and qualitative methods, we employ a theoretical lens of Social Influence to explore how individuals and organizations employed Twitter to promote charitable initiatives. User engagement on Twitter centered on content sharing, identification through hashtags, and imitative behaviors promoted the Wall of Kindness initiative across countries. Results from the thematic analysis revealed that Twitter users were tweeting about the Wall of Kindness to provide information, encourage donations, inspire others into action, and build an online community. Our content analysis revealed that a majority of the tweets were neutral and supportive of the initiative; users mostly shared textual information, followed by images, videos, tweeted news links, and solicited donations about the Wall of Kindness. Furthermore, media organizations, wall enthusiasts, and journalists were most active in tweeting about the charity initiative. Implications for future research are discussed.

  • Research Conferences in Communication

    Research Conferences in Communication

    Following is a list of major conferences in Communication and related fields:

    ConferencePaper Submission DeadlineVenue
    ICAInternational Communication Association (ICA)“ICA is an academic association for scholars interested in the study, teaching and application of all aspects of human and mediated communication.”
    Website: https://www.icahdq.org/
     Nov 01 USA & International
     BEA Broadcast Education Association (BEA)“The Broadcast Education Association (BEA) is the premiere international academic media organization, driving insights, excellence in media production, and career advancement for educators, students, and professionals. The association’s publications, annual convention, web-based programs, and regional district activities provide opportunities for juried production competition and presentation of current scholarly research related to aspects of the electronic media. These areas include media audiences, economics, law and policy, regulation, news, management, aesthetics, social effects, history, and criticism, among others.  BEA is concerned with electronic media curricula, placing an emphasis on interactions among the purposes, developments, and practices of the industry and imparting this information to future professionals.  BEA serves as a forum for exposition, analysis and debate of issues of social importance to develop members’ awareness and sensitivity to these issues and to their ramifications, which will ultimately help students develop as more thoughtful practitioners.”Websitehttps://www.beaweb.org/wp/ Dec 01 Las Vegas(BEA 2018, April 07-10, 2018)
    ABCAssociation for Business Communication (ABC)“The Association for Business Communication (ABC) is an international, interdisciplinary organization committed to advancing business communication research, education, and practice.”Website: http://www.businesscommunication.org/DecOctober 24-272018 conference in Miami, FL
      ICWSMThe International AAAI Conference on Web and Social Media (ICWSM)ICWSM is a forum for researchers from multiple disciplines to come together to share knowledge, discuss ideas, exchange information, and learn about cutting-edge research in diverse fields with the common theme of online social media. This overall theme includes research in new perspectives in social theories, as well as computational algorithms for analyzing social media. ICWSM is a singularly fitting venue for research that blends social science and computational approaches to answer important and challenging questions about human social behavior through social media while advancing computational tools for vast and unstructured data.Websitehttp://www.icwsm.org/ Jan 06 May 15 – 18
     IAMCRThe International Association for Media and Communication Research – (IAMCR)“IAMCR is the preeminent worldwide professional organisation in the field of media and communication research.”Websitehttp://iamcr.org/ Feb 15 International
    (IAMCR 2018 in Eugene, Oregon, June 20-24, 2018)
     AOIRThe Association of Internet Researchers (AOIR)“AOIR is an academic association dedicated to the advancement of the cross-disciplinary field of Internet studies. It is a member-based support network promoting critical and scholarly Internet research independent from traditional disciplines and existing across academic borders. The association is international in scope.”Websitehttps://aoir.org/ March 01 #AOIR2018 in Montreal, Canada (9-13 October 2018)(#AoIR2019 Brisbane, Australia)
     NCANational Communication Association (NCA)“The National Communication Association advances Communication as the discipline that studies all forms, modes, media, and consequences of communication through humanistic, social scientific, and aesthetic inquiry.”Websitehttps://www.natcom.org/  March 29 USA(NCA2017, Nov 16 – 19, 2017)(NCA2018, Salt Lake City Nov08 -Nov11, 2018)
     AEJMCThe Association for Education in Journalism and Mass Communication (AEJMC)“The Association for Education in Journalism and Mass Communication (AEJMC) is a nonprofit, educational association of journalism and mass communication educators, students and media professionals. The Association’s mission is to promote the highest possible standards for journalism and mass communication education, to cultivate the widest possible range of communication research, to encourage the implementation of a multi-cultural society in the classroom and curriculum, and to defend and maintain freedom of communication in an effort to achieve better professional practice and a better informed public.”Websitehttp://www.aejmc.org/ Apr 01 (August 6-9, 2018, Washington D.C./Chicago)
    ACM-CSCWComputer-Supported Cooperative Work (CSCW)“The ACM conference on Computer-Supported Cooperative Work and Social Computing is an international and interdisciplinary conference focused on how technology intersects with social practices. The conference will offer several types of submission including papers, posters, demos, workshops, panels, doctoral colloquium…CSCW is the premier venue for research in the design and use of technologies that affect groups, organizations, communities, and networks. Bringing together top researchers and practitioners, CSCW explores the technical, social, material, and theoretical challenges of designing technology to support collaborative work and life activities.”Websitehttps://cscw.acm.org/2018/submit.html April 20 CSCW2018, November 3-7, 2018, New York City’s Hudson River (Jersey City)
    ACM-GROUP GROUP Conference“For over 25 years, the ACM International Conference on Supporting Group Work (GROUP) has been a premier venue for research on Computer Supported Cooperative Work, Human Computer Interaction, Computer Supported Collaborative Learning and Socio-Technical Studies. The conference integrates work in social science, computer science, engineering, design, values, and other diverse topics related to group work, broadly conceptualized. Group 2018 continues the tradition of being truly international and interdisciplinary in both organizational structure as well as participants.”Websitehttp://group.acm.org/ June 23 Jan 7 -10, Sanibel Island, Florida
    ACM-CHIComputer Human Interaction (CHI)“The ACM CHI Conference on Human Factors in Computing Systems is the premier international conference of Human-Computer Interaction. For first-time attendees, CHI is a place where researchers and practitioners gather from across the world to discuss the latest in interactive technology.”Websitehttps://sigchi.org/