
We’re drowning in data but starving for insight. Here’s how I’m helping communicators bridge that gap.
I started my recent talk with a question I often pose to audiences: “When you see the word analytics, what’s your honest first reaction—excitement, confusion, or skepticism?”
The responses vary, but there’s usually a pattern. Some people lean forward with genuine curiosity. Others shift uncomfortably, associating analytics with spreadsheets, technical jargon, and numbers that seem to obscure rather than illuminate. A few remain skeptical—they’ve seen too many dashboards that promise insight but deliver only information overload.
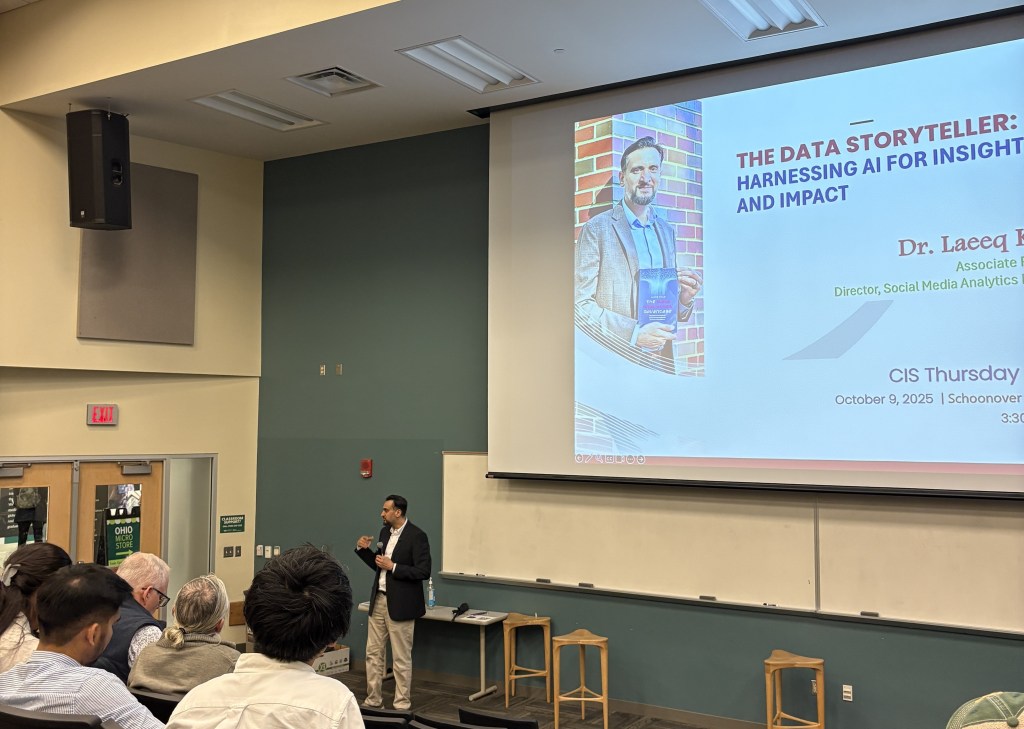
That range of reactions captures precisely why I do this work. As Associate Professor and Director of the Social Media Analytics Research Team (SMART Lab) at Ohio University, I’ve spent years exploring what I call the data paradox: we live in an era of unprecedented information abundance, yet we’re struggling to transform that data into meaningful understanding.
My talk addressed this tension directly. How do we move from merely collecting data to actually learning from it? How do we turn metrics into meaning, and numbers into narratives that drive change?

The Data Paradox: When More Means Less
Consider this: every single day, our world generates 2.5 quintillion bytes of data. That’s a number so large it becomes almost meaningless. Organizations meticulously track every click, view, share, and scroll. They build sophisticated dashboards that visualize engagement rates, reach metrics, and conversion funnels.
Yet despite—or perhaps because of—this abundance, many find themselves paralyzed. They have the data but lack the insight. They can tell you what happened but not why it matters or what to do next.
This is the paradox I’ve devoted my career to addressing. More data doesn’t automatically mean more understanding. In fact, without the right frameworks and questions, more data often means more confusion.
The solution isn’t gathering even more information. It’s about asking better questions and connecting the answers to human stories. It’s about recognizing that behind every data point is a person, and behind every trend is a community of lived experiences.
When Metrics Mislead: A Tale of Two Strategies
Let me illustrate this with two contrasting case studies I often share with my students and colleagues.
First, consider Meta’s Threads, launched in 2023 with enormous fanfare. The platform achieved record-breaking sign-ups—100 million users in just five days. By conventional metrics, it looked like an unqualified success. Headlines celebrated the numbers. Analysts predicted Twitter’s demise.
Then reality set in. Within weeks, Threads lost approximately 80 percent of its active users. The vanity metrics—the impressive sign-up numbers—had masked deeper problems. What the raw data didn’t reveal was user retention, community formation, or meaningful engagement patterns. Organizations focused on the excitement of acquisition while ignoring the critical signals that predict long-term viability.
Now contrast that with Spotify Wrapped. Every December, millions of users eagerly await their personalized year-in-review summaries. They share them across social platforms. They compare listening habits with friends. They discover artists they didn’t know they loved. Some even feel seen and understood by their own data.
What’s the difference? Spotify transformed analytics into self-expression. They made data emotional. They didn’t just tell users “you listened to 42,000 minutes of music this year.” They said “you were in the top 1% of fans for this artist” and “your music taste took you on a journey through these genres.” The data became personal, meaningful, shareable.
The insight here is profound: data alone doesn’t inspire action or create connection. Storytelling does. Context does. Empathy does.
The DAV Framework: From Numbers to Narratives
This conviction—that analytics must be fundamentally human-centered—drives my new book, The Data Analytics Advantage (Oxford University Press, 2025). In it, I introduce what I call the DAV Framework: Discovery, Analysis, Visualization.
The framework isn’t just a technical process; it mirrors how communicators naturally think and work:
Discovery begins with curiosity. What questions matter? What patterns might exist beneath the surface? What stories are waiting to be told? This stage is about purposeful exploration, not aimless data collection. It requires us to approach information with both rigor and imagination.
Analysis builds meaning from what we discover. It’s where we move from observation to interpretation, from correlation to potential causation. This stage demands critical thinking—the ability to see connections, identify outliers, and resist the temptation to let our assumptions dictate our conclusions.
Visualization turns insight into impact. It’s where we make the invisible visible, where complexity becomes comprehensible, where evidence becomes persuasive. Good visualization isn’t just about making pretty charts; it’s about designing clarity and facilitating understanding.
AI as Creative Partner, Not Replacement
Artificial intelligence has transformed every stage of this storytelling process. I’m often asked whether AI will replace data analysts or make human interpretation obsolete. My answer is always the same: AI augments the storyteller; it doesn’t replace them.
Consider what AI enables us to do now. We can scrape and process massive datasets that would take humans months to compile manually. We can use natural language processing to cluster topics and detect sentiment across thousands of conversations. We can generate visualizations that reveal patterns invisible to the human eye. We can test hypotheses and iterate analyses at speeds previously unimaginable.
But—and this is crucial—AI can’t replace human judgment. It can show us patterns, but it can’t tell us which patterns matter or why. It can cluster comments by sentiment, but it can’t understand the cultural context that gives those sentiments meaning. It can generate correlation, but it can’t determine causation or ethical implication.
The goal isn’t automation for its own sake. It’s collaboration between human curiosity and machine capability. The best data storytelling emerges when we combine AI’s computational power with human wisdom, ethical reasoning, and contextual understanding.
The Profoundly Human Future of Analytics
I closed my talk with a message I want every student, communicator, and organization to internalize: behind every dataset is a human story waiting to be understood.
The future of analytics isn’t purely technical. It’s not about bigger models, faster processing, or more sophisticated algorithms—though those things matter. The future of analytics is profoundly human. It requires us to embrace the tools of artificial intelligence while never losing sight of empathy, ethics, and meaning.
Data storytelling is ultimately about translation: taking the language of numbers and speaking it in the language of human experience. It’s about building bridges between evidence and emotion, between pattern and purpose, between what happened and why it matters.
As we move deeper into an age of algorithmic mediation and artificial intelligence, this work becomes more essential, not less. We need people who can read data with both technical skill and humanistic wisdom. We need communicators who understand that analytics isn’t separate from storytelling—it’s a powerful form of it.
My call to action is simple: learn these tools, but never let them replace your curiosity. Master these methods, but never forget why measurement matters. Build your technical capabilities, but always ground them in empathy.
Because in the end, the data storyteller isn’t defined by algorithms or visualizations. The data storyteller is defined by the ability to turn information into understanding, and understanding into impact that improves human lives.
That’s the work. That’s the opportunity. That’s what excites me about analytics.

Reflections from my talk at the CIS Forum at Ohio University, October 9, 2025


Leave a comment